WWLLN
Global Lightning Climatological Datasets and Animations
Introduction
The World-Wide Lightning Location Network (WWLLN) has continuously monitored global lightning since 2004. We are pleased to make available for climate research several datasets aggregated from WWLLN lightning detections and a wide variety of animations.
What exactly does WWLLN observe?
WWLLN sensors monitor very low frequency (VLF) radiation (3-30 kHz) and detect wave packets (“sferics”) emitted during lightning discharges. When multiple (at least five) sensors detect these wave packets, the WWLLN processing system uses time of group arrival (TOGA) and minimization methods to locate the lightning stroke in space and time. For more information on how this is done, see Dowden et al. (2002).
Lightning flashes often contain multiple strokes, or electrical discharges. WWLLN preferentially detects and locates the strongest stroke within the flash, and its detection efficiency is higher for strong cloud-to-ground strokes. For more information on what WWLLN detects and how to compare it with lightning flash datasets, see Rodger et al. (2005) and Virts et al. (2013).
What climatologies are available, and which should I use?
The two most common ways to quantify lightning occurrence are:
· How much lightning occurs? This is the stroke density: the number of strokes observed at a particular location during a period of time.
· How often does a location experience lightning? This is the thunder hours: the number of hours during which you would hear thunder at a particular location.
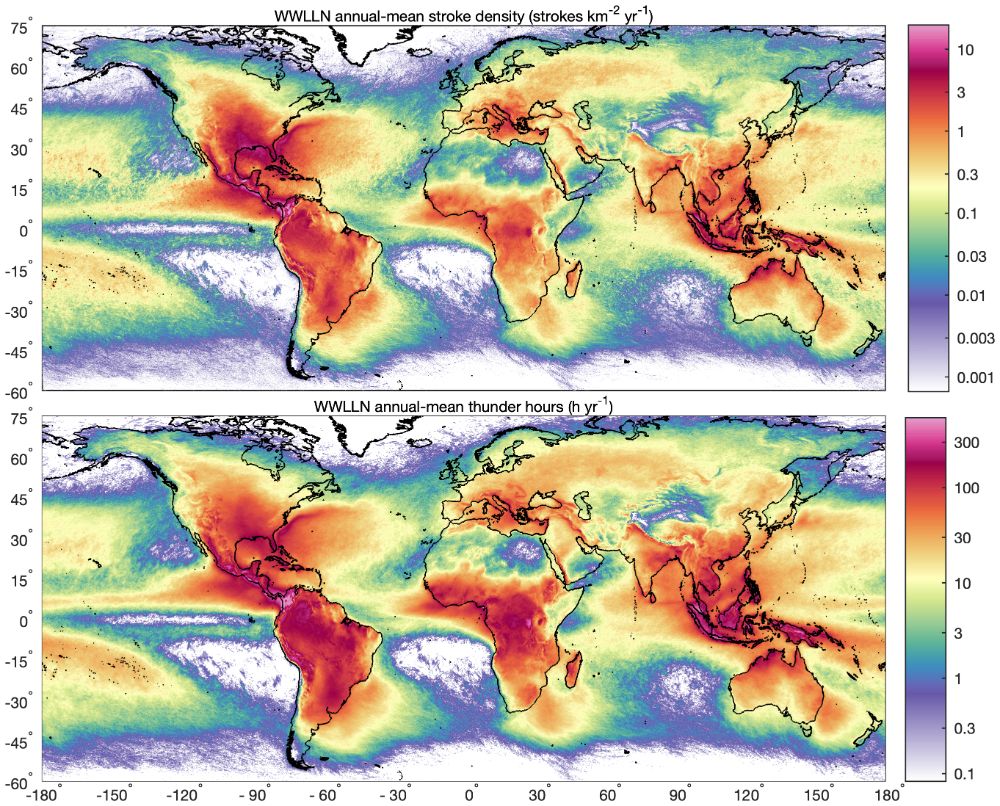
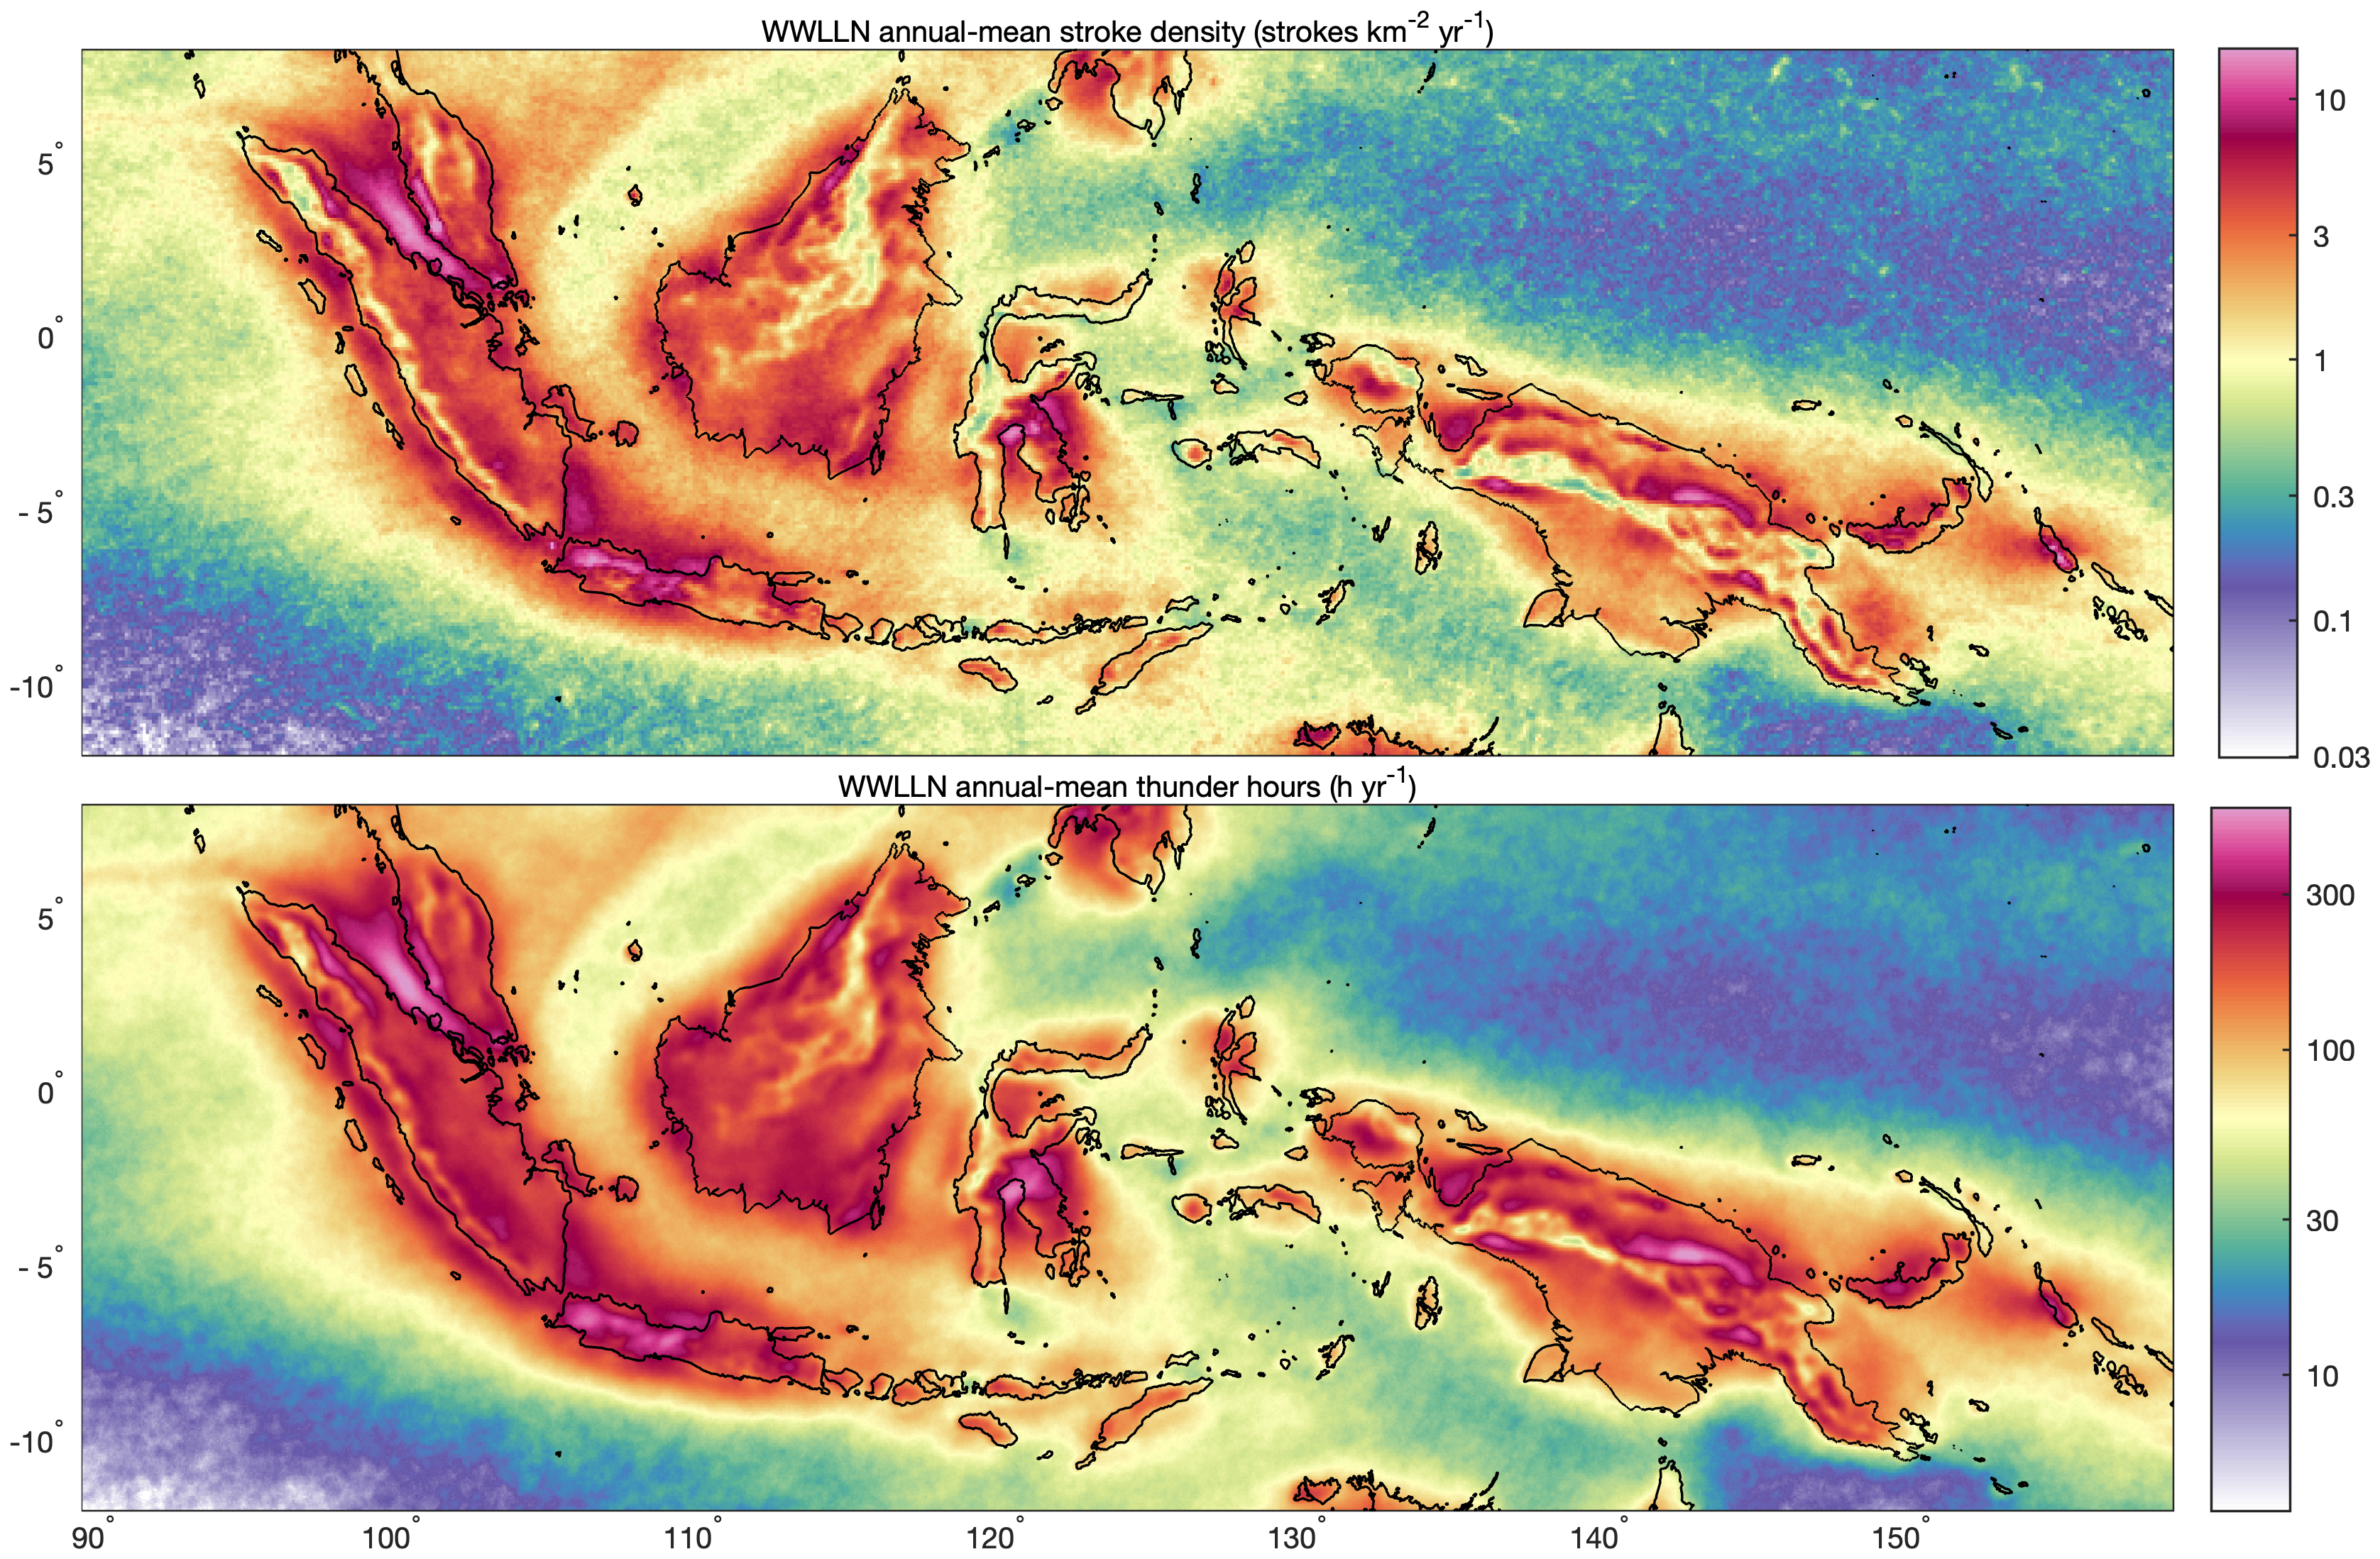
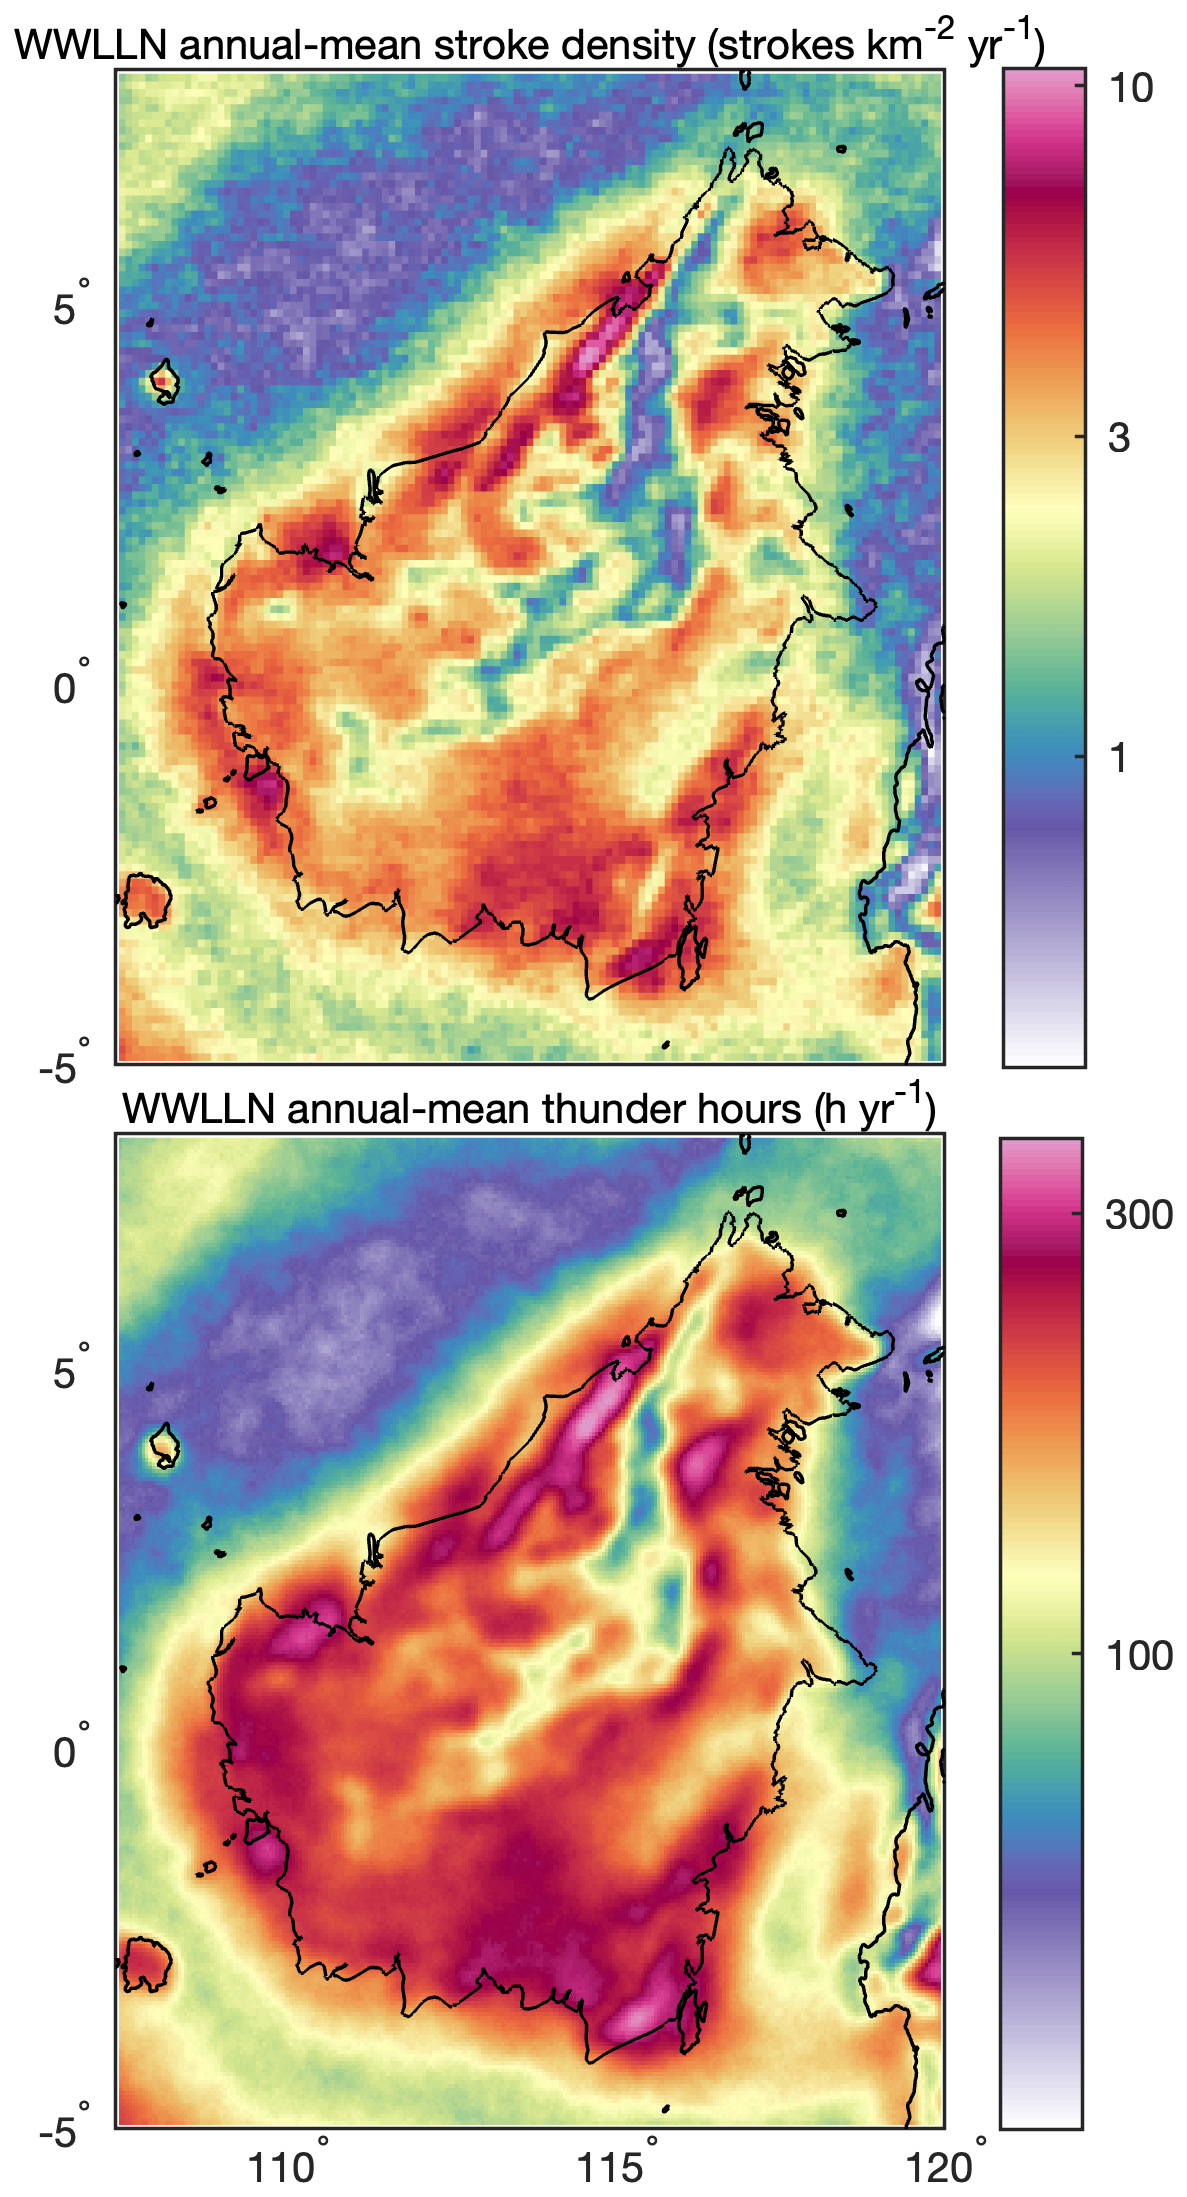
Overall, the stroke density and thunder hour patterns are very similar. Thunder hours are more robust for comparing across regions or networks, since a network’s detection efficiency for thunderstorms is much higher than for individual lightning flashes. The thunder hour pattern is also smoother because thunder hours are calculated using a 15-km radius—which may smear out small-scale features of interest. This is more evident in smaller regions such as Indonesia and Borneo (note: for each plot, the color limits are the 0.01st and 99.99th percentiles).
WWLLN offers four gridded climatological lightning datasets. Each dataset page includes plots and animations; in particular, an extensive library of regional animations is available for the stroke density climatology and thunder hour climatology.
· Global stroke density time series summed by month. Use this climatology to: see how much lightning occurred during individual months and years, and how the number of lightning detections changes over time.
· Global stroke density climatology averaged by month and/or hour. Use this climatology to: see how much lightning occurs throughout the day and year.
· Global thunder hour time series summed by month. Use this climatology to: see how often lightning occurred during individual months and years, and how the occurrence of thunderstorms changes over time.
· Global thunder hour climatology averaged by month and/or hour. Use this climatology to: see how often lightning occurs on average throughout the day and year.
Data use instructions
The WWLLN climatologies are available for research (i.e., non-commercial) use. When using the data, please:
· Read the dataset description carefully to ensure that you understand how the climatology was derived and apply the data properly
· Follow the citation instructions on the dataset landing page
Questions?
Please send questions to Katrina Virts or Bob Holzworth